【numpy】meshgrid メモ
f([a,b])という関数があったとするとf([[a,b], [c,d]])というのは[f([a,b]), f([c,d])]と同じ結果を出力するのはnumpyやmatplotlibの常套らしい.
>>> import numpy as np
>>> x = np.array([1,2,3])# l * m
>>> y = np.array([10,11])# n * k
>>> xx, yy = np.meshgrid(x,y)
>>> xx
array([[1, 2, 3],
       [1, 2, 3]])
>>> yy
array([[10, 10, 10],
       [11, 11, 11]])
xx, yy = np.meshgrid(x,y)ではlen(y)*len(x)の行列を2つ作る.
2次元配列に拡張すると
>>> x = np.array([[10,11],[3,4],[5,6]])#3*2
>>> y = np.array([[1,2,3,4],[5,6,7,8]])#2*4
>>> xx, yy = np.meshgrid(x,y)
>>> xx
array([[10, 11,  3,  4,  5,  6],
       [10, 11,  3,  4,  5,  6],
       [10, 11,  3,  4,  5,  6],
       [10, 11,  3,  4,  5,  6],
       [10, 11,  3,  4,  5,  6],
       [10, 11,  3,  4,  5,  6],
       [10, 11,  3,  4,  5,  6],
       [10, 11,  3,  4,  5,  6]])
>>> yy
array([[1, 1, 1, 1, 1, 1],
       [2, 2, 2, 2, 2, 2],
       [3, 3, 3, 3, 3, 3],
       [4, 4, 4, 4, 4, 4],
       [5, 5, 5, 5, 5, 5],
       [6, 6, 6, 6, 6, 6],
       [7, 7, 7, 7, 7, 7],
       [8, 8, 8, 8, 8, 8]])
となり(len(y[0])*len(y[1])) * (len(x[0])*len(x[1]))となった.
xxとyyの各成分が重複なく全ての組み合わせとなるように対応している.
これは格子点を生成していると考えられる.
だから実際には上のような使い方は趣旨にあっていなくて, np.arange()などで生成した配列を引数にとるのが格子点を作る上で正しい使い方と言えるだろう.
自分がサンプルプログラムで見たのは
h = 0.02#格子点の間隔
xx, yy = np.meshgrid(np.arange(x.min()-1, x.max()+1, h), np.arange(y.min()-1, y.max()+1, h))#x,yはnp.array()
Z = clf.predict(np.c_[xx.ravel(),yy.ravel()]).reshape(xx.shape)
out = ax.contourf(xx,yy,Z,**params)
これでclassificationの識別領域を塗りつぶせる.
Z = clf.predict(np.c_[xx.ravel(),yy.ravel()]).reshape(xx.shape)
この処理を一つずつ追っていく.
>>> x = np.array([1,2,3,4])
>>> y = np.array([5,6,7,8])
>>> xx, yy = np.meshgrid(x,y)
>>> xx
array([[1, 2, 3, 4],[1, 2, 3, 4],[1, 2, 3, 4],[1, 2, 3, 4]])
>>> yy
array([[5, 5, 5, 5],[6, 6, 6, 6],[7, 7, 7, 7],[8, 8, 8, 8]])
# xx.ravel()で, 一行のベクトルに変形する.
>>> xx.ravel()
array([1, 2, 3, 4, 1, 2, 3, 4, 1, 2, 3, 4, 1, 2, 3, 4])
>>> yy.ravel()
array([5, 5, 5, 5, 6, 6, 6, 6, 7, 7, 7, 7, 8, 8, 8, 8])
# np.c_[]で第2軸方向に行列の連結を行う(xx,yyはnp.meshgrid()によって大きさが同じことが保証されている).
# これにより格子点を要素とした配列ができあがる.
>>> np.c_[xx.ravel(),yy.ravel()]
array([[1, 5],
       [2, 5],
       [3, 5],
       [4, 5],
       [1, 6],
       [2, 6],
       [3, 6],
       [4, 6],
       [1, 7],
       [2, 7],
       [3, 7],
       [4, 7],
       [1, 8],
       [2, 8],
       [3, 8],
       [4, 8]])
# 2次元空間上でこれらはテストデータの集合ともとれるので宣言した識別モデルclfのpredict()にかける
# 各格子点に対応したクラスのラベルが返ってくる
>>> clf.predict(np.c_[xx.ravel(),yy.ravel()])
np.array([0,1,1,1,0,0,1,1,0,0,0,1,0,0,0,1])
# 最後にxxの形に整形する
>> clf.predict(np.c_[xx.ravel(), yy.ravel()]).reshape(xx)#4*4行列
np.array([0,1,1,1],
         [0,0,1,1],
         [0,0,0,1],
         [0,0,0,1])
# これでxxとyyとZの各要素が対応し, 2次元グラフにおける点とクラスがわかる.
# plt.pcolormesh(xx,yy,Z,...)で領域を図示する
deepage.net
このブログの図が分かりやすい.
【参考】
https://deepage.net/features/numpy-meshgrid.html
http://kaisk.hatenadiary.com/entry/2014/11/05/041011
https://qiita.com/sotetsuk/items/d0e73afdcffdc8ac3e6b
https://qiita.com/ynakayama/items/3250452949102840e624
matplotlibで使えるcolormap
https://matplotlib.org/examples/color/colormaps_reference.html
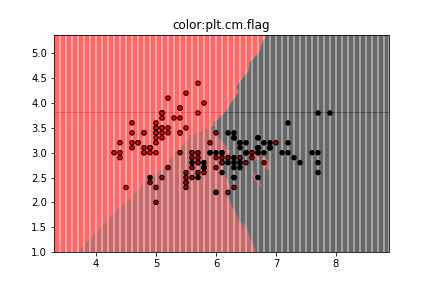
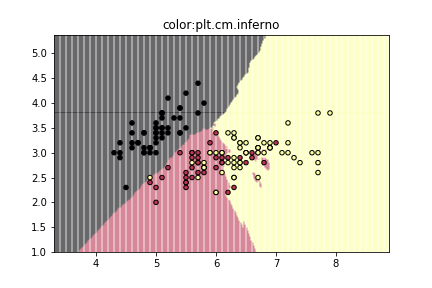
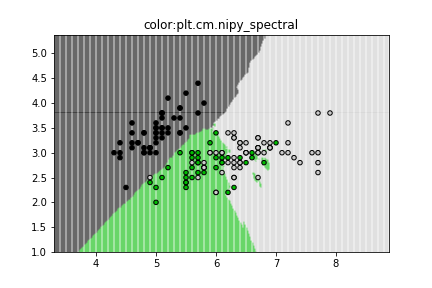
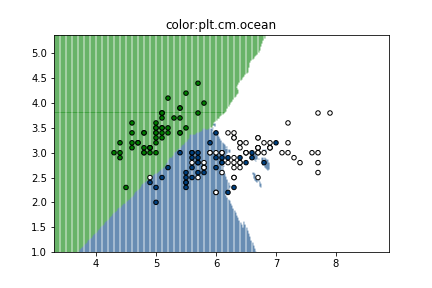
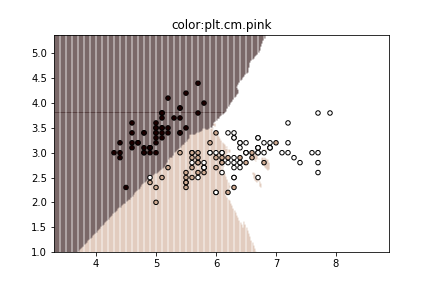
ここに載っているcolormap一覧をk-NN classificationの図に適応してみた.
3色だと個人的にはjet, prismあたりが見やすくて好み.
色の定義はこのように[("A",["color1","color2"]),...]のようになっているらしい.
cmaps = [('Perceptually Uniform Sequential', [
            'viridis', 'plasma', 'inferno', 'magma']),
         ('Sequential', [
            'Greys', 'Purples', 'Blues', 'Greens', 'Oranges', 'Reds',
            'YlOrBr', 'YlOrRd', 'OrRd', 'PuRd', 'RdPu', 'BuPu',
            'GnBu', 'PuBu', 'YlGnBu', 'PuBuGn', 'BuGn', 'YlGn']),
         ('Sequential (2)', [
            'binary', 'gist_yarg', 'gist_gray', 'gray', 'bone', 'pink',
            'spring', 'summer', 'autumn', 'winter', 'cool', 'Wistia',
            'hot', 'afmhot', 'gist_heat', 'copper']),
         ('Diverging', [
            'PiYG', 'PRGn', 'BrBG', 'PuOr', 'RdGy', 'RdBu',
            'RdYlBu', 'RdYlGn', 'Spectral', 'coolwarm', 'bwr', 'seismic']),
         ('Qualitative', [
            'Pastel1', 'Pastel2', 'Paired', 'Accent',
            'Dark2', 'Set1', 'Set2', 'Set3',
            'tab10', 'tab20', 'tab20b', 'tab20c']),
         ('Miscellaneous', [
            'flag', 'prism', 'ocean', 'gist_earth', 'terrain', 'gist_stern',
            'gnuplot', 'gnuplot2', 'CMRmap', 'cubehelix', 'brg', 'hsv',
            'gist_rainbow', 'rainbow', 'jet', 'nipy_spectral', 'gist_ncar'])]








【参考】
https://qiita.com/mommonta3/items/cea310b2c36a01b970a6
https://matplotlib.org/examples/color/colormaps_reference.html
【numpy】paddingメモ
#--- 1次元配列 ---
> a = [2,3]
> np.pad(a,[1,0],"constant")
np.array([0,2,3])#先頭に1個, 末尾に0個 0padding
> np.pad(a,[1,2],"constant")
np.array([0,2,3,0,0])#先頭に1個, 末尾に2個 0padding

#-- 2次元配列 ---
a = [[1,2],[3,4]]
> np.pad(a,[(1,2),(3,4)],"constatnt")
array([[0, 0, 0, 0, 0, 0, 0, 0, 0],
       [0, 0, 0, 1, 2, 0, 0, 0, 0],
       [0, 0, 0, 3, 4, 0, 0, 0, 0],
       [0, 0, 0, 0, 0, 0, 0, 0, 0],
       [0, 0, 0, 0, 0, 0, 0, 0, 0]])#行の先頭に1行, 行の末尾に2行, 列の先頭に3列, 列の末尾に4列 0padding
【numpy】多次元配列を1次元配列にする
> x = np.arange(16).reshape(4, 4)
array([[0, 1, 2, 3],
       [4, 5, 6, 7],
       [8, 9, 10, 11],
       [12, 13, 14, 15]])

# 方法1
> x.reshape(-1,)
array([0, 1, 2, 3, 4, 5, 6, 7, 8, 9, 10, 11, 12, 13, 14, 15])


# 方法2
> np.ravel(x)
array([0, 1, 2, 3, 4, 5, 6, 7, 8, 9, 10, 11, 12, 13, 14, 15])
多次元配列の型がnp.arrayならメソッドとして
>a = np.array([[1,2],[3,4]])
>a.ravel()
array([1,2,3,4])
>np.ravel(a)
array([1,2,3,4])

>b = [[1,2],[3,4]]
>b.ravel()
#エラー
>np.array(b)
array([1,2,3,4])
git 設定 メモ
gitの設定で参照にしたサイトメモ
入門
https://qiita.com/ay3/items/8d758ebde41d256a32dc
https://qiita.com/KosukeQiita/items/cf39d2922b77ac93f51d
sshの設定
https://qiita.com/shizuma/items/2b2f873a0034839e47ce
https://qiita.com/drapon/items/441e18452b25060d61f1
http://monsat.hatenablog.com/entry/generating-ssh-keys-for-github
configファイルの設定
#設定確認
git config --list
#設定追加
git config key value
#設定削除
git config --unset key
configファイルの編集
emacs .git/config
【scikit-learn】クラスタリング手法 日本語の文献
scikit-learn documentのclusteringを読むときに役立つ日本語の文献をメモ
2.3.3 Affinity Propagation
2.3.4 Mean Shift
http://seiya-kumada.blogspot.jp/2013/05/mean-shift.html
http://blog.livedoor.jp/itukano/archives/51806727.html
http://takashiijiri.com/study/ImgProc/MeanShift.htm
2.3.5 Spectal Clustering
2.3.6 Hierarchical Clustering
2.3.7 DBSCAN
https://media.accel-brain.com/dbscan/
https://qiita.com/takechanman/items/c7f23873c087630bab18
https://qiita.com/_Me_takuya/items/a2f0b007b1f30869064a
2.3.8 Birch
【shell】よく使うものメモ
ディレクトリ内の.apkファイルを.zipファイルに一括変換する
$for filename in *.apk;do
>mv "$filename" "${filename%.apk}.zip";
>done
filenameのところに""で囲んでないと空白文字があるファイルに対して操作できない場合があるので注意
ディレクトリ内の画像の名前を連番にする
ls *.jpg | awk '{ printf "mv %s %03d.jpg\n", $0, NR }' | sh
カレントディレクトリの各ファイルの容量
du -sh ./*/
CVPR2017の論文をスクレイピングする
wget -r -l 1 -A pdf pdf -w 5 -nd http://openaccess.thecvf.com/CVPR2017.py
ディレクトリ毎のファイル数を確認する
for x in * ; do echo $x ; ls -1UR $x | wc -l ; done
CSVをTSVに変換する
cat hoge.csv | tr "," "\\t" > fuga.tsv
twitterAPIを用いたtimelineの取得【その2】
あるアカウントを200ツイート取得してCSVに保存する
from requests_oauthlib import OAuth1Session
import json
from urllib import request
import subprocess
import csv

keys = {
            "CK":'xxx',
            "CS":'xxx',
            "AT":'xxx',
            "AS":'xxx',
        }
sess = OAuth1Session(keys["CK"], keys["CS"], keys["AT"], keys["AS"])

#タイムラインの最も上にいる人のツイートを100件取得する
url = "https://api.twitter.com/1.1/statuses/user_timeline.json"
usr_id = str(input("tweetを取得したいidを入力:"))
params = {"screen_name":usr_id,#ユーザーネーム
          "count":200, #ツイートを最新から何件取得するか(最大200件)
          "exclude_replies":"true",
          "inclue_rts":"true"
          }
req = sess.get(url,params=params)
if req.status_code == 200:
    #レスポンスはJSON形式なのでparseする
    timeline = json.loads(req.text)
    file_name = dir_path + params["screen_name"] + ".csv"
    with open(file_name,"w") as f:
        writer = csv.writer(f,lineterminator="\n")
        for i,tweet in enumerate(timeline):
            tw_id = tweet["id_str"]#1: id
            tw_created_at = tweet["created_at"].split(" ")
            tw_created_at_year = tw_created_at[-1]#2: year
            tw_created_at_month = tw_created_at[1]#3: month
            tw_created_at_date = tw_created_at[2]#4: date
            tw_created_at_time = tw_created_at[3]#5: time
            tw_place = tweet["place"]
            if tw_place is not None:
                tw_place_id = tw_place["id"]#6: place_id
                tw_place_full_name = tw_place["full_name"]#7: place_name
            else:
                tw_place_id = ""
                tw_place_full_name = ""
            tw_txt = tweet["text"]
            a_tweet_info_list = [tw_id,tw_created_at_year,tw_created_at_month,tw_created_at_date,tw_created_at_time,tw_place_id,tw_place_full_name,tw_txt]
            writer.writerow(a_tweet_info_list)
GETリクエスト時のパラメータであるinclude_rtsはfalseにしてもRTを含んだツイートとなってしまったのだが, 解決方法がわからなかった.
どうしてもRTを除外したツイートを取得したい場合は, 各ツイートに対して
if tweet["text"][:3] is not "@RT":
||<
twitterAPIを用いたtimelineの取得
from requests_oauthlib import OAuth1Session
import json
from urllib import request

keys = {
            "CK":'xxxxx',
            "CS":'xxxxx',
            "AT":'xxxxx',
            "AS":'xxxxx',
        }
sess = OAuth1Session(keys["CK"], keys["CS"], keys["AT"], keys["AS"])

url = "https://api.twitter.com/1.1/statuses/home_timeline.json"
params = {"count":200, #ツイートを最新から何件取得するか(最大200件)
          "include_entities" : 1, #エンティティ(画像のURL等)をツイートに含めるか
          "exclude_replies" : 1, #リプライを含めるか
          }

req = sess.get(url, params=params)
timeline = json.loads(req.text)

print(timeline[0]["user"])
自分のツイートを取得したところこのようになった.
{'id': 863468411120005120, 'id_str': '863468411120005120', 'name': '🐈', 'screen_name': 'tristana_chan', 'location': '',\
 'description': '有益なことは呟かないため鍵垢にしていますがフォローお気軽に', 'url': None,'entities': {'description': {'urls': []}}, \
'protected': True, 'followers_count': 40, 'friends_count': 395, 'listed_count': 0, 'created_at': 'Sat May 13 18:58:06 +0000 2017',\
'favourites_count': 2884, 'utc_offset': -25200, 'time_zone': 'Pacific Time (US & Canada)', 'geo_enabled': False, 'verified': False,\
 'statuses_count': 3281, 'lang': 'ja', 'contributors_enabled': False, 'is_translator': False, 'is_translation_enabled': False,\
 'profile_background_color': 'F5F8FA', 'profile_background_image_url': None, 'profile_background_image_url_https': None,\
 'profile_background_tile': False, 'profile_image_url': 'http://pbs.twimg.com/profile_images/899736954631094272/JtKhe4RD_normal.jpg',\
 'profile_image_url_https': 'https://pbs.twimg.com/profile_images/899736954631094272/JtKhe4RD_normal.jpg', 'profile_link_color': '1DA1F2',\
 'profile_sidebar_border_color': 'C0DEED', 'profile_sidebar_fill_color': 'DDEEF6', 'profile_text_color': '333333', 'profile_use_background_image': True,\
 'has_extended_profile': False, 'default_profile': True, 'default_profile_image': False, 'following': False, 'follow_request_sent': False, 'notifications': False,\
 'translator_type': 'none'}
今後有効そうなkey値だけまとめておく.
| key | value |
| name | ユーザーの名前 |
| screen_name | ユーザーID(@以降) |
| location | 住んでるところ(設定していない場合は"") |
| description | ユーザーの紹介文 |
| url | ユーザーが設定しているURL |
| protected | Trueならば鍵垢 |
| followers_count | フォロワー数 |
| friends_count | フォロー数 |
| listed_count | 登録されているリスト数 |
| created_at | アカウントが作られた日 |
| lang | 使用している言語(日本語なら"ja") |
| profile_image_url | プロフィールのイメージのURL(http) |
| profile_image_url_https | プロフィールのイメージのURL(https) |
タイムライン上のプロフィール画像を取得する
from requests_oauthlib import OAuth1Session
import json
from urllib import request
import subprocess
keys = {
            "CK":'xxxxx',
            "CS":'xxxxx',
            "AT":'xxxxx',
            "AS":'xxxxx',
        }
sess = OAuth1Session(keys["CK"], keys["CS"], keys["AT"], keys["AS"])

url = "https://api.twitter.com/1.1/statuses/home_timeline.json"
params = {"count":200, #ツイートを最新から何件取得するか(最大200件)
          "include_entities" : 1, #エンティティ(画像のURL等)をツイートに含めるか
          "exclude_replies" : 1, #リプライを含めるか
          }

req = sess.get(url, params=params)
timeline = json.loads(req.text)

#タイムライン上にいる100人の人のイメージアイコンをダウンロードする
dir_path = "./profile_images/"
url_set = set()
for tweet in timeline:
    #プロフィールの画像URLを取得
    image_url = tweet["user"]["profile_image_url"]
    #画像の拡張子を取得
    image_ex = image_url.split(".")[-1].replace("jpeg","jpg")#jpg, png, gif
    #ユーザの名前を取得
    user_id = tweet["user"]["name"].replace(" ","_")
    if image_url not in url_set:
        url_set.add(image_url)
        file_name = user_id + "." + image_ex
        args = ["wget",image_url,"-O",dir_path+file_name]
        subprocess.call(args)
    else:
        pass
のようにするとタイムライン上のアカウントのプロフィール画像を取得できる.

(個人アカウントはモザイク済み)
Pythonで積分計算
区分求積法より
と
をはさんだものが積分の値となるので分割数nを大きくすればその値に近似できる.
今回はについて計算する.
まずは区分求積法をnumpyで実装.
import numpy as np
import matplotlib.pyplot as plt
n = 1000
x = np.linspace(0,1,n)
y = x*(1-x)**2
ans = np.sum(y)/n
print(ans)#0.0832499165832
科学計算用のライブラリが用意されている.
import nunmpy as np
import scipy import integrate

def compute(x):
    return x*(1-x)**2

ans = integrate.quad(compute,0,1)# ans = integrate.quad(lambda x:x*(1-x)**2,0,1)
print(ans)#(0.08333333333333334, 9.251858538542972e-16)
こちらは誤差まで議論されている.
pygeocoderのインストール
1. ファイルをダウンロードし解凍
https://pypi.python.org/pypi/pygeocoder
2. 以下のコマンドを実行
$ python setup.py build; python setup.py install;
はてなブログのデザインを一部いじる
まずオリジナルのデザインはこちら

今回はブラウザがGoogleChromeでやることを想定する.
1.F12キーを押すとブラウザの右か下にバーが現れるので, その左上マウスのマークをクリック

2.オリジナルのデザインで変更したい部分にマウスを当てクリックする
3.該当箇所のCSSが表示される
今回は
.entry-content pre.code {
    color: #333;
    border: none;
    padding: 20px;
    background: #f6f6f2;
    font-size: 85%;
    margin: 0.8em 0;
}
のbackgroundを#f6f6f2から#CCCに変更する.
このCSSを全てコピーする.
4.はてなのメニューの「デザイン」から「デザインCSS」をクリック
そこに先ほどのコピーしたCSSを貼り付ける.
改変したい箇所#f6f6f2を#CCCに変更する.
5.デザイン変更完了

【Ubuntu】MeCabインストール
Ubuntu16.06LTSにMeCabとPython3用のMeCabのインストールを行った.
MeCabのインストール
1. Gitからcloneして展開する
$ git clone --depth 1 https://github.com/neologd/mecab-ipadic-neologd.git
2. mecab-ipadic-NEologdをインストールする
$ ./bin/install-mecab-ipadic-neologd -n -a
3. 実行する
自分の場合は/usr/local/lib/mecab/dic/mecab-ipadic-neologd/にあったため
$ macab -d /usr/local/lib/mecab/dic/mecab-ipadic-neologd/
4. コマンドとして設定する
いちいちパスを宣言するのは面倒なので
$ alias mecab="mecab /usr/local/lib/mecab/dic/mecab-ipadic-neologd/"
Python3でMeCabを使う
1. 辞書のPATHを設定
sudo emacs /usr/local/etc/mecabrc
;dicdir = /usr/local/lib/mecab/dic/ipadic; これを消す
dicdir = /usr/local/lib/mecab/dic/mecab-ipadic-neologd;これを追加
2. GoogleDriveからPython3用のファイルを取得
https://drive.google.com/drive/folders/0B4y35FiV1wh7fjQ5SkJETEJEYzlqcUY4WUlpZmR4dDlJMWI5ZUlXN2xZN2s2b0pqT3hMbTQ
ここからMeCab-python3.*というファイルを取得し解凍
3. インストール
先ほど解凍したところに移って
$ python setup.py build
$ python setup.py install
4. 試しに使ってみる
import MeCab
mecab = MeCab.Tagger("-Ochasen")
print(mecab.parse("今日の天気は晴れです。"))
引用:http://blueskydb.blog.jp/archives/67055421.html
【参考】
・http://blueskydb.blog.jp/archives/67055421.html
・http://qiita.com/mojibakeo/items/2906162edf7045899974
・http://qiita.com/knknkn1162/items/8c12f42dd167aae01c02
・https://github.com/neologd/mecab-ipadic-neologd
・https://pypi.python.org/pypi/mecab-python3
・http://toriaezu-engineer.hatenablog.com/entry/2016/08/24/234145
・http://qiita.com/yuichy/items/5c8178e5cc3711386b77
確率分布書き方
ポアソン分布の作り方
import scipy.stats
import numpy as np
import matplotlib.pyplot as plt
#figsize(12.5,4)

lambda_ = [1.5, 4.25]
colors = ["#348ABD","#A60628"]

a = np.arange(16)
plt.bar(a,scipy.stats.poisson.pmf(a,lambda_[0]),color=colors[0],label="$\lambda=%.1f$"%lambda_[0],alpha=0.60,edgecolor=colors[0],lw="3")
plt.bar(a,scipy.stats.poisson.pmf(a,lambda_[1]),color=colors[1],label="$\lambda=%.1f$"%lambda_[1],alpha=0.60,edgecolor=colors[1],lw="3")

plt.xticks(a+0.4,a)
plt.legend()
plt.ylabel("Probability of $k$")#kの確率
plt.xlabel("$k$")
plt.title("Probability mass function of a Poisson random variable, differing $\lambda$ values")
plt.show()

指数分布
import numpy as np
import matplotlib.pyplot as plt
import scipy.stats

a = np.linspace(0,4,100)
lambda_ = [0.5,1]
colors=["#348ABD","#A60628"]

for l,c in zip(lambda_,colors):
    plt.plot(a,scipy.stats.expon.pdf(a,scale=1./l),lw=3,color=c,label="$\lambda=%.1f$"%l)
    plt.fill_between(a,scipy.stats.expon.pdf(a,scale=1./l),color=c,alpha=.33)

plt.legend()
plt.ylabel("Probability density function at $z$")#zにおける確率密度関数
plt.xlabel("$z$")
plt.ylim(0,1.2)
plt.title("Probability density function of an exponential random variable, differing $\lambda$ values")
plt.savefig("exponential_distribution.png")

ベイズ推論イントロ

Pythonで体験するベイズ推論 PyMCによるMCMC入門
- 作者: キャメロンデビッドソン=ピロン,玉木徹
- 出版社/メーカー: 森北出版
- 発売日: 2017/04/06
- メディア: 単行本(ソフトカバー)
- この商品を含むブログを見る
世界に司書と農家しか職業選択が無いときに司書と農家の人口比は1:20である.
Steveが内向的でおとなしい性格だという情報を得たときに, Steveは司書である確率はどのくらいなのであるのだろうか?
をSteveが司書である確率とする.
このとき求めたいのはSteveが内向的な性格であるとわかった上で, Steveが司書であるという確率である.
ベイズの定理より
は司書であるときに内向的な性格であるという確率である. これは0.95とする.
は司書である確率なので
である.
より,
は農家であるときに内向的な性格である確率で0.5とする.
するとより
となる.
これを図にすると下のようになる.

「Steveは内向的な性格だ」という事前情報を得たときの「Steveが司書である」という事後確率は少し高くなった.
コードは以下の通りである.
from IPython.core.pylabtools import figsize
import numpy as np
import matplotlib.pyplot as plt
figsize(12.5,4)
colors = ["#348ABD","#A60628"]
pr_farmer = 1/21
pr_librarian = 1 - pr_farmer
prior = [pr_farmer,pr_librarian]#事前確率
posterior = [0.087,1-0.087]#事後確率
plt.bar([0,.7],prior,alpha=0.7,width=0.25,color=colors[0],label="Prior distribution",lw="3",edgecolor="#348ABD")#事前確率
plt.bar([0+0.25,.7+0.25],posterior,alpha=0.7,width=0.25,color=colors[1],label="Posterior distribution",lw="3",edgecolor="#A60628")#事後確率
plt.xticks([0.2,0.95],["Librarian","Farmer"])#司書, 農家
plt.ylabel("Probability")#確率
plt.legend(loc="upper left")
plt.title("Prior and posterior probabilities of Steve's occupation")
plt.show()
今回はを0.5に設定したがそれを0-1.0に変化させたときにどう変わっていくかを観察する.
つまり「Steveが農家だという情報が分かっているときに, Steveが内向的である確率」P(X|notA)の変化によって, Steveが司書、農家である事後確率はどのように変化するのか?
from IPython.core.pylabtools import figsize
import numpy as np
import matplotlib.pyplot as plt

figsize(12.5,4)

plt.figure()
plt.subplots_adjust(wspace=0.4, hspace=0.6)

colors = ["#348ABD","#A60628"]
pr_farmer = 1/21
pr_librarian = 1 - pr_farmer
prior = [pr_farmer,pr_librarian]#事前確率

a = np.linspace(0,1,11)
print(a)
for i,_ in enumerate(a):
    #Steveが農家であるときに内向的である事後確率
    p_x = 0.95*(1/21) + _ *(20/21)
    pos = (0.95*(1/21))/p_x
    posterior = [pos,1-pos]#事後確率
    print(i)
    plt.subplot(6,2,i+1)
    plt.bar([0,.7],prior,alpha=0.7,width=0.25,color=colors[0],label="Prior distribution",lw="3",edgecolor="#348ABD")#事前確率
    plt.bar([0+0.25,.7+0.25],posterior,alpha=0.7,width=0.25,color=colors[1],label="Posterior distribution",lw="3",edgecolor="#A60628")#事後確率

    plt.title("P(X|notA) = "+str(_))
plt.show()

これはとなるため,
x=0のとき「Steveが内向的だという情報を得たときのSteveが司書である」事後確率は1.0となる.
しかし,0.2以降は事後確率があまりかわらないことがわかった.
試しにグラフを書いてみた.
import numpy as np
import matplotlib.pyplot as plt
x =  np.linspace(0,1.,1000)
y = 0.95/(0.95+20*x)
plt.scatter(x,y)
plt.show()
