【ギャラリー】k-meansクラスタリングにおける画像減色を3Dグラフに表す
k = 1

k = 2

k = 3

k = 4

k = 5

k = 6

k = 7

k = 8

k = 9

k = 10

k =20

k = 30

k = 50

k = 70

k = 100

k = 200

k = 300

【python】 ゼロパディングする
文字列をゼロパディングする方法を調べた.
文字列メソッドのzfill(桁数)を用いればよい.
>>> num_str = "30"
>>> num_str.zfill(4)
0030
【参考】
・http://www.lifewithpython.com/2015/10/python-zero-padding.html
【python】 proxy下でデータセットをダウンロードする
以下の設定を書く.
import urllib.request
# proxy の設定
proxy_support = urllib.request.ProxyHandler({'http' : 'http://***.***.***:port',
                                             'https': 'https://***.***.***:port'})
opener = urllib.request.build_opener(proxy_support)
urllib.request.install_opener(opener)
これを事前に書けば
# CIFAR-10データセットをロード
from keras.datasets import cifar10
(X_train, y_train), (X_test, y_test) = cifar10.load_data()
print(X_train.shape, y_train.shape)
print(X_test.shape, y_test.shape)
でエラーを起こさない.
【python】 日本語CSVの読み込み時のエンコーディング
encoding = "utf-8"と指定する必要がある
with open(filename, "r", encoding = "utf-8") as f:
     reader = csv.reader(f)
     header = next(reader)
     for row in reader:
         print(row)
【pandas】 DataFrameから特定の列の取り出し方

取り出したい項目["color", "size", price"]を指定して
X = df[["color", "size", "price"]]
のようにして取り出す.
一列の場合なら
df.color

df["color"]
によって"color"の列が取り出せる.
行を取り出すには
#先頭から3行目まで
df[:3]
のようにリストのように扱う.
その他にも条件を指定して抽出したり, 位置を指定して抽出する方法があるらしい.
【参考】
http://pythondatascience.plavox.info/pandas/%E8%A1%8C%E3%83%BB%E5%88%97%E3%81%AE%E6%8A%BD%E5%87%BA
【python】 辞書のキーと値を逆にする操作
辞書型のキーと値の順番を変更した辞書をつくる.
順序特徴量でL, M, Sという文字列の値がある場合, 数値として扱うために
class_mapping = {"L":3, "M":2, "S":1}
のような辞書を定義し, 文字列を数値にする.
これを再び元の形に戻したい場合はinv_class_mapping = {v:k for k,v in class_mapping.items()}
のようにキーと値の順番を入れ替えて同じ操作をすればよい.
class_mapping = {"L":3, "M":2, "S":1}
df["size"] = df["size"].map(class_mapping)
inv_class_mapping = {v:k for k,v in dictionary.items()}
df["size"] = df["size"].map(inv_class_mapping)
【pandas】 pandas.dataframeのCSVの入力と出力
pandasのdataframeとCSVファイルのやりとりメモ
import pandas as pd

# CSV -> dataframe
df = pd.read_csv(input_csv_path)

# dataframe -> CSV
df.to_csv(output_csv_path)
【numpy】配列の結合np.hstack(tup)メモ
np.hsatck()では縦方向(axis=1)の結合ができる.
行列a, bに対してaxis=1のみが違うならば, aとbは結合できる.
すなわちa.shape[1]とb.shape[1]のみが異なり, a.shapeとb.shapeの他の要素が同じならば結合可能となる.
その他の結合方法としてcolumn_stack()による横方向の結合, dstak()による深さ方向の結合, vstack(),row_stack()による縦方向の結合などがあるらしい.
またnp.meshgrid()で格子点の制作に使ったnp.c_()も結合の関数である.
この場合はaとbのサイズが同じでなければならない.
> a = np.arange(8).reshape((2,4))
> b = np.arange(100,900,100).reshape(2,4)

> print(a)
[[0 1 2 3]
 [4 5 6 7]]

> print(b)
[[100 200 300 400]
 [500 600 700 800]]

> print(np.r_[a, b])
[[  0   1   2   3]
 [  4   5   6   7]
 [100 200 300 400]
 [500 600 700 800]]

> print(np.c_[a, b])
[[  0   1   2   3 100 200 300 400]
 [  4   5   6   7 500 600 700 800]]
結合があれば分解もあって,np.split()というものがあるらしいが, 今回はまだ勉強しない_(:3」∠)_
【参考】
・http://python-remrin.hatenadiary.jp/entry/concatenate
・https://deepage.net/features/numpy-stack.html
【Python】help()について
クラス参照するときにhelp()関数を使うとJupyter notebook内で参照できるため便利
import sklearn
import sklearn.linear_model
help(sklearn.linear_model.Perceptron)
下のような説明が出てくる.
Help on class Perceptron in module sklearn.linear_model.perceptron:

class Perceptron(sklearn.linear_model.stochastic_gradient.BaseSGDClassifier, sklearn.feature_selection.from_model._LearntSelectorMixin)
 |  Perceptron
 |
 |  Read more in the :ref:`User Guide <perceptron>`.
 |
 |  Parameters
 |  ----------
 |
 |  penalty : None, 'l2' or 'l1' or 'elasticnet'
 |      The penalty (aka regularization term) to be used. Defaults to None.
 |
~~~~~~~~~~~~~~~~~~~~~~~~~~~
識別結果の評価
手元にトレーニングようデータX,yがあったら
X_train, y_train, X_test, y_test のトレーニングデータと検証データに分割する
from sklearn.cross_validation import train_test_split
#トレーニングデータと検証データに分割
#全体の30%をテストデータにする
X_train, X_test, y_train, y_test = train_test_split(X,y,test_size=0.3,random_state=0)
次に識別結果の評価として誤識別されたサンプルの数と正解率を出力する.
# 識別器が誤分類したサンプルの数
print("Misclassified samples: %d"%((y_test != y_pred).sum()))
# 識別器の正解率
from sklearn.metrics import accuracy_score
print("Accuracy: %.2f"%accuracy_score(y_test,y_pred))
誤識別に関する操作はこのような感じ

【numpy】meshgrid メモ
f([a,b])という関数があったとするとf([[a,b], [c,d]])というのは[f([a,b]), f([c,d])]と同じ結果を出力するのはnumpyやmatplotlibの常套らしい.
>>> import numpy as np
>>> x = np.array([1,2,3])# l * m
>>> y = np.array([10,11])# n * k
>>> xx, yy = np.meshgrid(x,y)
>>> xx
array([[1, 2, 3],
       [1, 2, 3]])
>>> yy
array([[10, 10, 10],
       [11, 11, 11]])
xx, yy = np.meshgrid(x,y)ではlen(y)*len(x)の行列を2つ作る.
2次元配列に拡張すると
>>> x = np.array([[10,11],[3,4],[5,6]])#3*2
>>> y = np.array([[1,2,3,4],[5,6,7,8]])#2*4
>>> xx, yy = np.meshgrid(x,y)
>>> xx
array([[10, 11,  3,  4,  5,  6],
       [10, 11,  3,  4,  5,  6],
       [10, 11,  3,  4,  5,  6],
       [10, 11,  3,  4,  5,  6],
       [10, 11,  3,  4,  5,  6],
       [10, 11,  3,  4,  5,  6],
       [10, 11,  3,  4,  5,  6],
       [10, 11,  3,  4,  5,  6]])
>>> yy
array([[1, 1, 1, 1, 1, 1],
       [2, 2, 2, 2, 2, 2],
       [3, 3, 3, 3, 3, 3],
       [4, 4, 4, 4, 4, 4],
       [5, 5, 5, 5, 5, 5],
       [6, 6, 6, 6, 6, 6],
       [7, 7, 7, 7, 7, 7],
       [8, 8, 8, 8, 8, 8]])
となり(len(y[0])*len(y[1])) * (len(x[0])*len(x[1]))となった.
xxとyyの各成分が重複なく全ての組み合わせとなるように対応している.
これは格子点を生成していると考えられる.
だから実際には上のような使い方は趣旨にあっていなくて, np.arange()などで生成した配列を引数にとるのが格子点を作る上で正しい使い方と言えるだろう.
自分がサンプルプログラムで見たのは
h = 0.02#格子点の間隔
xx, yy = np.meshgrid(np.arange(x.min()-1, x.max()+1, h), np.arange(y.min()-1, y.max()+1, h))#x,yはnp.array()
Z = clf.predict(np.c_[xx.ravel(),yy.ravel()]).reshape(xx.shape)
out = ax.contourf(xx,yy,Z,**params)
これでclassificationの識別領域を塗りつぶせる.
Z = clf.predict(np.c_[xx.ravel(),yy.ravel()]).reshape(xx.shape)
この処理を一つずつ追っていく.
>>> x = np.array([1,2,3,4])
>>> y = np.array([5,6,7,8])
>>> xx, yy = np.meshgrid(x,y)
>>> xx
array([[1, 2, 3, 4],[1, 2, 3, 4],[1, 2, 3, 4],[1, 2, 3, 4]])
>>> yy
array([[5, 5, 5, 5],[6, 6, 6, 6],[7, 7, 7, 7],[8, 8, 8, 8]])
# xx.ravel()で, 一行のベクトルに変形する.
>>> xx.ravel()
array([1, 2, 3, 4, 1, 2, 3, 4, 1, 2, 3, 4, 1, 2, 3, 4])
>>> yy.ravel()
array([5, 5, 5, 5, 6, 6, 6, 6, 7, 7, 7, 7, 8, 8, 8, 8])
# np.c_[]で第2軸方向に行列の連結を行う(xx,yyはnp.meshgrid()によって大きさが同じことが保証されている).
# これにより格子点を要素とした配列ができあがる.
>>> np.c_[xx.ravel(),yy.ravel()]
array([[1, 5],
       [2, 5],
       [3, 5],
       [4, 5],
       [1, 6],
       [2, 6],
       [3, 6],
       [4, 6],
       [1, 7],
       [2, 7],
       [3, 7],
       [4, 7],
       [1, 8],
       [2, 8],
       [3, 8],
       [4, 8]])
# 2次元空間上でこれらはテストデータの集合ともとれるので宣言した識別モデルclfのpredict()にかける
# 各格子点に対応したクラスのラベルが返ってくる
>>> clf.predict(np.c_[xx.ravel(),yy.ravel()])
np.array([0,1,1,1,0,0,1,1,0,0,0,1,0,0,0,1])
# 最後にxxの形に整形する
>> clf.predict(np.c_[xx.ravel(), yy.ravel()]).reshape(xx)#4*4行列
np.array([0,1,1,1],
         [0,0,1,1],
         [0,0,0,1],
         [0,0,0,1])
# これでxxとyyとZの各要素が対応し, 2次元グラフにおける点とクラスがわかる.
# plt.pcolormesh(xx,yy,Z,...)で領域を図示する
deepage.net
このブログの図が分かりやすい.
【参考】
https://deepage.net/features/numpy-meshgrid.html
http://kaisk.hatenadiary.com/entry/2014/11/05/041011
https://qiita.com/sotetsuk/items/d0e73afdcffdc8ac3e6b
https://qiita.com/ynakayama/items/3250452949102840e624
matplotlibで使えるcolormap
https://matplotlib.org/examples/color/colormaps_reference.html
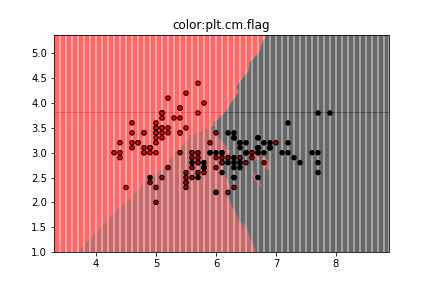
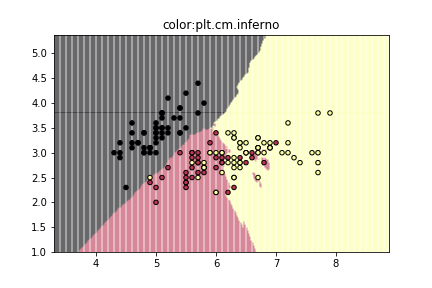
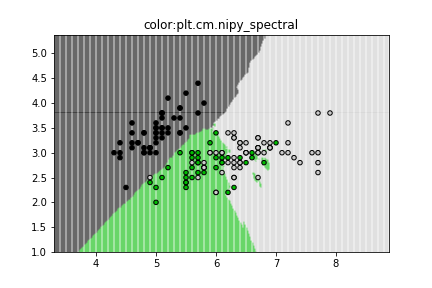
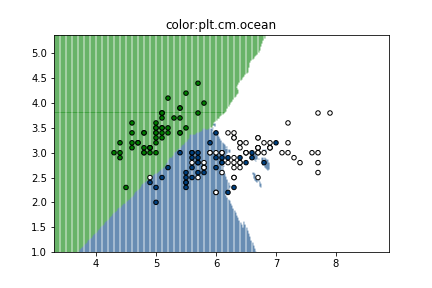
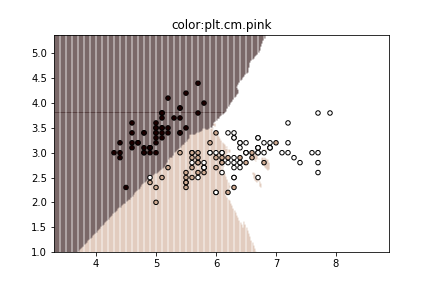
ここに載っているcolormap一覧をk-NN classificationの図に適応してみた.
3色だと個人的にはjet, prismあたりが見やすくて好み.
色の定義はこのように[("A",["color1","color2"]),...]のようになっているらしい.
cmaps = [('Perceptually Uniform Sequential', [
            'viridis', 'plasma', 'inferno', 'magma']),
         ('Sequential', [
            'Greys', 'Purples', 'Blues', 'Greens', 'Oranges', 'Reds',
            'YlOrBr', 'YlOrRd', 'OrRd', 'PuRd', 'RdPu', 'BuPu',
            'GnBu', 'PuBu', 'YlGnBu', 'PuBuGn', 'BuGn', 'YlGn']),
         ('Sequential (2)', [
            'binary', 'gist_yarg', 'gist_gray', 'gray', 'bone', 'pink',
            'spring', 'summer', 'autumn', 'winter', 'cool', 'Wistia',
            'hot', 'afmhot', 'gist_heat', 'copper']),
         ('Diverging', [
            'PiYG', 'PRGn', 'BrBG', 'PuOr', 'RdGy', 'RdBu',
            'RdYlBu', 'RdYlGn', 'Spectral', 'coolwarm', 'bwr', 'seismic']),
         ('Qualitative', [
            'Pastel1', 'Pastel2', 'Paired', 'Accent',
            'Dark2', 'Set1', 'Set2', 'Set3',
            'tab10', 'tab20', 'tab20b', 'tab20c']),
         ('Miscellaneous', [
            'flag', 'prism', 'ocean', 'gist_earth', 'terrain', 'gist_stern',
            'gnuplot', 'gnuplot2', 'CMRmap', 'cubehelix', 'brg', 'hsv',
            'gist_rainbow', 'rainbow', 'jet', 'nipy_spectral', 'gist_ncar'])]








【参考】
https://qiita.com/mommonta3/items/cea310b2c36a01b970a6
https://matplotlib.org/examples/color/colormaps_reference.html


